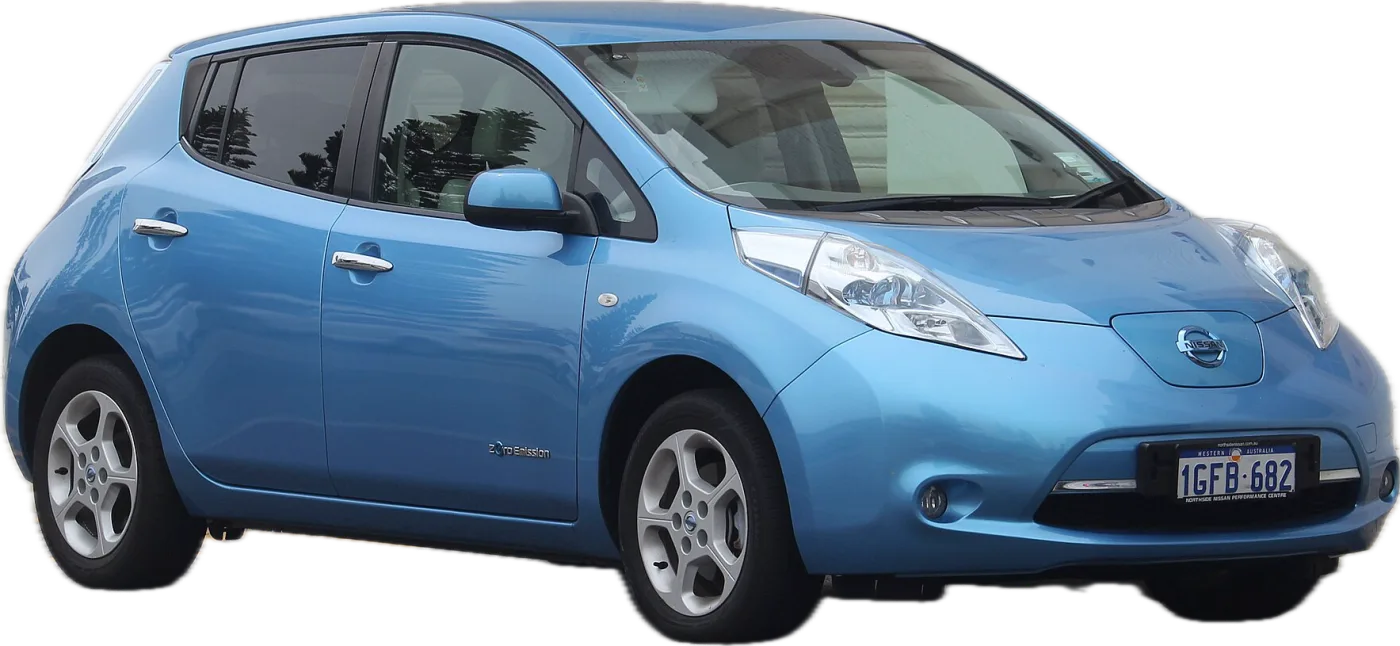
Verdict
The 2016 Nissan Leaf passes its MOT first time on 77.7% of tests, against 80.8% for a typical car of the same age and mileage. That beats 24% of cars on UK roads, below the Leaf as a whole, which beats about a third.
It was level with a typical car of the same age and mileage for its first four MOTs, at 3 to 6 years old, then fell behind: about 3–4 points at 7 and 6–10 points from 8 to 10. Across all Leaf years it is slightly ahead of a typical car up to 30,000 miles and mostly 5–8 points behind from 60,000 miles.
Later Leafs do much better: 2018–2022 cars beat about six in ten cars or more, against about one in eight for 2013 and 2014 cars. 2016 sits between, ahead of 2015 cars and behind 2017 ones, which are a little below average.
Suspension is the weak spot: ball joints fail about 7.6 times as often as on a typical car, on about 1 in 20 tests, and handbrake performance 3.8 times. Steering, body and lights fail less often than on a typical car. The MOT doesn't test the battery or motor, so ask for a battery health report too, and electric cars have no exhaust emissions test, which flatters the comparison a little.
Watch these weak spots
MOT pass rate by age
First-time pass rate at each MOT.
Where it fails
Each area compared with a typical car of the same age and mileage, in points of pass rate. Tap or hover an area to see what to check.
Every MOT area
Share of tests failing on each area, against a typical car of the same age and mileage (black line).
Buying one or MOT due? Check these
- Suspension ball joints
The most common fail, on about 1 in 20 tests: 7.5 times the typical rate, and an advisory on about 1 in 33 more. Listen for knocks over speed bumps and feel for wandering or vague steering. - Handbrake
Handbrake performance fails 3.8 times as often as on a typical car, on about 1 in 50 tests. Check the handbrake holds the car firmly on a slope. - Brake discs
Fail about 1.9 times as often as on a typical car (about 1 in 90 tests) and are an advisory on about 1 in 6 tests, nearly twice the typical rate. Look through the wheel spokes for scored discs or a heavy rust lip on the edge. - Suspension arm bushes
Fail about 1.6 times as often as on a typical car and are an advisory on about 1 in 14 tests, nearly 3 times the typical rate. Listen for knocks or creaks over bumps. - Tyres
Tyres fail about 1.3 times as often as on a typical car, on about 1 in 14 tests, for damage or tread depth. Check both sidewalls of every tyre for cuts, bulges and cracking, and for at least 3 mm of tread including the inner edge. - Wipers and washers
Wipers fail on about 1 in 35 tests, about 1.4 times as often as on a typical car, and washers about 1.3 times. Test both before the MOT. - Battery health
The MOT doesn't test the battery or motor. Ask for a battery health report and check the range shown on a full charge.
Pass rate by mileage
First-time pass rate by mileage at the test.
Most common MOT failures
| Item | This car | Typical | vs typical |
|---|---|---|---|
| Suspension ball joints | 5.0% | 0.7% | 7.6× |
| Tyre damage & cracking | 3.9% | 3.1% | 1.3× |
| Windscreen wipers | 2.9% | 2.0% | 1.4× |
| Tyre tread depth | 2.8% | 2.0% | 1.4× |
| Handbrake performance | 2.1% | 0.5% | 3.8× |
| Windscreen washers | 1.8% | 1.4% | 1.3× |
| Headlight aim | 1.5% | 1.9% | 0.8× |
| Sidelights | 1.3% | 0.8% | 1.7× |
| Brake discs | 1.1% | 0.6% | 1.9× |
| Brake performance | 0.9% | 0.5% | 1.9× |
Specific defects found
Tester wording for the most frequent failure items, per 1,000 tests.
| Defect | per 1,000 |
|---|---|
| A suspension pin, bush or joint excessively worn | 64.5 |
| Wiper blade missing or obviously not clearing the windscreen | 29.1 |
| Tyre tread depth not in accordance with the requirements | 28.0 |
| A tyre seriously damaged | 24.9 |
| Windscreen washers not working or not providing sufficient fluid to clear the windscreen | 18.0 |
| The aim of a headlamp is not within limits laid down in the requirements | 14.9 |
| A tyre cords visible or damaged | 13.9 |
| A lamp missing, inoperative or in the case of a multiple light source more than 1/2 not functioning | 12.5 |
Pick a make and model to see its MOT pass rate, best and worst years and weak spots.
Advisories
Not a fail yet, but likely to need attention soon.
| Item | Share of tests | vs typical |
|---|---|---|
| Tyre tread depth | 19.5% | 1.2× |
| Brake discs | 17.6% | 1.9× |
| Tyre damage & cracking | 9.2% | 1.0× |
| Suspension arm bushes | 7.3% | 2.7× |
| Brake pads | 4.7% | 0.6× |
| Suspension ball joints | 3.0% | 5.5× |
| Brake performance | 1.7% | 1.6× |
| Coil springs | 1.4% | 1.8× |
Best and worst years
Leaf Electric by year, ranked against all cars on UK roads after adjusting for age and mileage. Green = better than half of cars.
Other 2016 Leaf engines
Grades compare each car with cars of the same age and mileage (A = best 20% of cars on UK roads, E = worst 20%), so an older or higher-mileage car can grade above one with a higher pass rate.
| Engine | Pass rate | Rank | Grade |
|---|---|---|---|
| Electric | 77.7% | Beats 24% | D |
FAQ
What is the MOT pass rate of a 2016 Nissan Leaf?
77.7% of MOT tests on the 2016 Nissan Leaf were passed first time, from 31,256 tests. A typical car of the same age and mileage passes 80.8%.
Is the 2016 Nissan Leaf reliable?
On MOT results it is below average: it beats 24% of cars on UK roads, and it falls further behind a typical car from about 7 years old. MOT results cover safety items, not the battery or motor.
Does the MOT test the Nissan Leaf's battery?
No. The MOT doesn't test an electric car's battery or motor, so ask for a battery health report before you buy. Electric cars also have no exhaust emissions test, which flatters their MOT results a little.
What are the most common MOT failures on the 2016 Nissan Leaf?
Suspension ball joints (about 1 in 20 tests, 7.6 times the typical rate), tyre damage, windscreen wipers and tyre tread depth.
Which Nissan Leaf years are best?
2018–2022 cars do best, beating about six in ten cars or more on UK roads once age and mileage are taken into account. 2013 and 2014 cars do worst, beating only about one in eight.