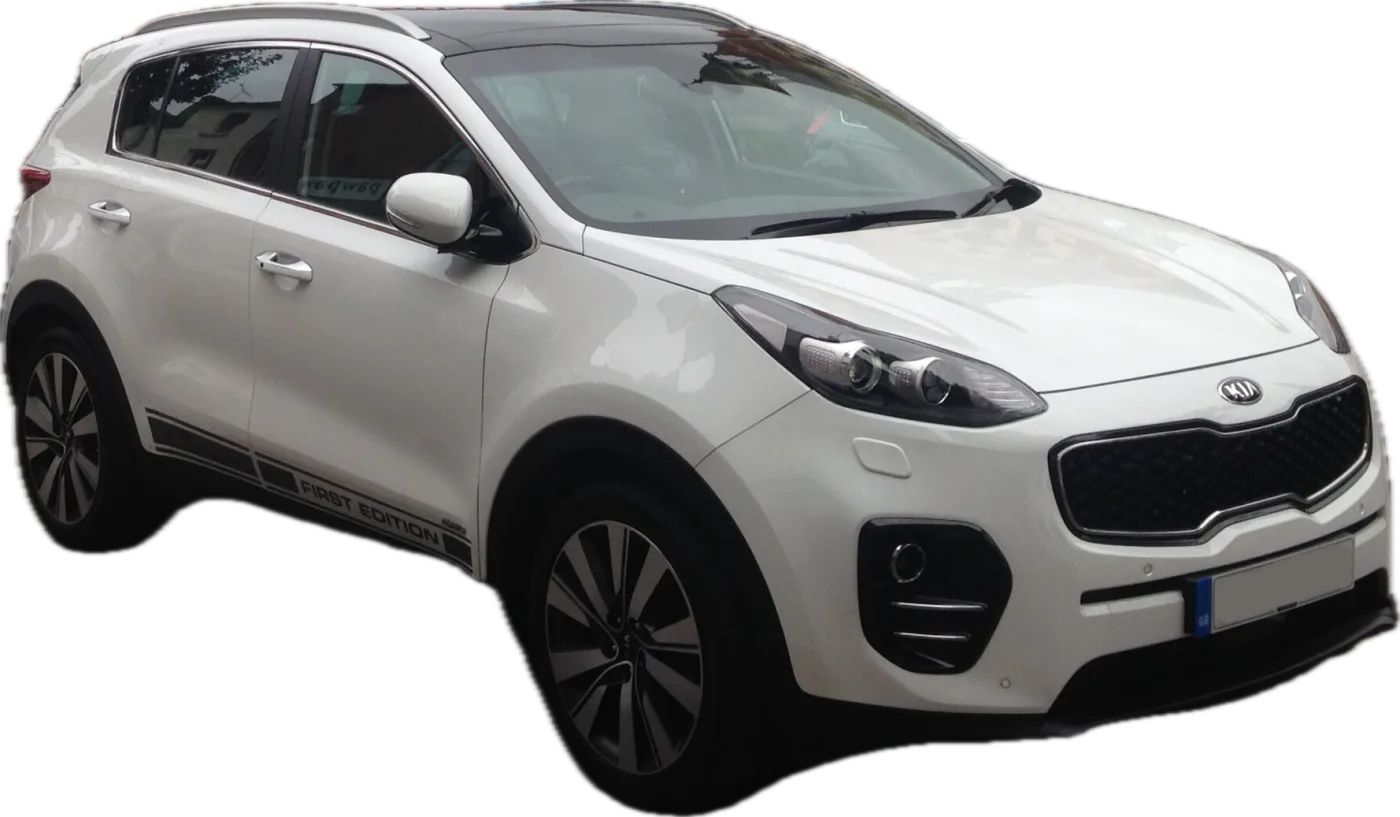
Verdict
The Kia Sportage passes its MOT first time on 77.3% of tests, against 77.1% for a typical car of the same age and mileage. It beats 51% of cars on UK roads: about average. Among family SUVs the Ford Kuga, Hyundai Tucson, Toyota RAV4, Honda CR-V and VW Tiguan do better; the Nissan Qashqai, Nissan X-Trail and Peugeot 3008 do worse.
It does best at 6–10 years old, up to about 2 percentage points ahead of a typical car of the same age and mileage, but is level again at 11 and falls behind from about 12 years, by about 4–5 points at 17–19 years.
The best years are 2014, which beats nearly two in three cars, and 2011, with 2016–2018 cars also above average. Cars from before 2008 beat fewer than four in ten, and 2020–2021 cars only about one in five, with suspension arm bushes, track rod ends and the electronic parking brake failing far more often than on a typical car.
Brakes and steering are the weak spots: brake fails come about 1.6 times as often as on a typical car, and handbrake performance about 2.8 times. Better than average on lights, body and emissions.
Watch these weak spots
MOT pass rate by age
First-time pass rate at each MOT by the car’s age in years.
Best and worst years
By year of first registration, ranked against all cars on UK roads after adjusting for age and mileage. Green = better than half of cars.
Engines
All years, most common first. Grades compare each car with cars of the same age and mileage (A = best 20% of cars on UK roads, E = worst 20%), so an older or higher-mileage car can grade above one with a higher pass rate.
| Engine | Pass rate | Rank | Grade |
|---|---|---|---|
| 1.7 Diesel | 75.2% | Beats 50% | C |
| 1.6 Petrol | 81.6% | Beats 41% | C |
| 2.0 Diesel | 73.4% | Beats 62% | B |
| 1.6 Hybrid | 86.7% | Beats 49% | C |
| 1.6 Diesel | 83.7% | Beats 54% | C |
| 2.0 Petrol | 57.8% | Beats 38% | D |
| 2.0 Hybrid | 84.0% | Beats 32% | D |
| 2.7 Petrol | 51.0% | Beats 35% | D |
Where it fails
Each area compared with a typical car of the same age and mileage, in points of pass rate. Tap or hover an area to see what to check.
Every MOT area
Share of tests failing on each area, against a typical car of the same age and mileage (black line).
Buying one or MOT due? Check these
- Brake pads
The Sportage's most common MOT fail, on about 1 in 29 tests (1.6 times the typical rate). Look through the wheels at the pad thickness and listen for grinding. - Handbrake
Handbrake performance fails about 3 times as often as on a typical car on 2011–2021 cars, and the lever itself about 6 times on 2016–2021 cars. Check it holds the car on a steep slope without the lever coming up too far. - Electronic parking brake
On cars from 2020 on it fails about 20 times as often as on a typical car, though still only on about 1 in 180 tests. Make sure it applies and releases cleanly and no warning light stays on. - Track rod ends and suspension bushes
Track rod ends fail about 1.7 times as often as on a typical car, and on 2020–2021 cars track rod ends and suspension arm bushes fail 6–7 times as often. Feel for knocking or play in the steering and look for uneven tyre wear. - Tyre tread
Tread depth fails about 1.3 times as often as on a typical car. Check every tyre, including the inner edge. - Tyre pressure warning (TPMS)
Fails about 1.5 times as often as on a typical car. Make sure no tyre-pressure warning stays on after start-up.
Pass rate by mileage
First-time pass rate by mileage at the test.
Most common MOT failures
| Item | This car | Typical | vs typical |
|---|---|---|---|
| Brake pads | 3.3% | 2.0% | 1.6× |
| Tyre tread depth | 3.2% | 2.4% | 1.3× |
| Windscreen wipers | 2.7% | 2.1% | 1.3× |
| Handbrake performance | 2.7% | 1.0% | 2.8× |
| Tyre damage & cracking | 2.2% | 3.5% | 0.6× |
| Headlight aim | 1.9% | 2.4% | 0.8× |
| Windscreen washers | 1.6% | 1.7% | 1.0× |
| Track rod ends | 1.5% | 0.9% | 1.7× |
| Suspension ball joints | 1.1% | 1.0% | 1.1× |
| Suspension arm bushes | 1.0% | 0.7% | 1.4× |
Specific defects found
Tester wording for the most frequent failure items, per 1,000 tests.
| Defect | per 1,000 |
|---|---|
| Tyre tread depth not in accordance with the requirements | 32.0 |
| A brake lining or pad worn below 1.5mm | 31.7 |
| Wiper blade missing or obviously not clearing the windscreen | 27.0 |
| A suspension pin, bush or joint excessively worn | 24.4 |
| The aim of a headlamp is not within limits laid down in the requirements | 19.4 |
| Windscreen washers not working or not providing sufficient fluid to clear the windscreen | 16.0 |
| Parking brake efficiency below minimum requirement | 14.2 |
| A tyre seriously damaged | 14.2 |
Pick a make and model to see its MOT pass rate, best and worst years and weak spots.
Every year and engine
Tap a year to see its engines. Grades compare each car with cars of the same age and mileage (A = best 20% of cars on UK roads, E = worst 20%), so an older or higher-mileage car can grade above one with a higher pass rate.
2023 Kia Sportage2 engines88.2% passC
| Engine | Pass rate | Rank | Grade |
|---|---|---|---|
| 1.6 Hybrid | 89.4% | Beats 70% | B |
| 1.6 Petrol | 85.0% | Beats 15% | E |
2022 Kia Sportage3 engines88.3% passC
| Engine | Pass rate | Rank | Grade |
|---|---|---|---|
| 1.6 Hybrid | 89.4% | Beats 68% | B |
| 1.6 Petrol | 87.2% | Beats 37% | D |
| 1.6 Diesel | 85.8% | Beats 38% | D |
2021 Kia Sportage2 engines84.7% passE
| Engine | Pass rate | Rank | Grade |
|---|---|---|---|
| 1.6 Petrol | 84.7% | Beats 16% | E |
| 1.6 Hybrid | 84.7% | Beats 30% | D |
2020 Kia Sportage4 engines84.0% passE
| Engine | Pass rate | Rank | Grade |
|---|---|---|---|
| 1.6 Petrol | 84.0% | Beats 16% | E |
| 1.6 Hybrid | 84.4% | Beats 33% | D |
| 1.6 Diesel | 81.1% | Beats 14% | E |
| 2.0 Hybrid | 83.3% | Beats 23% | D |
2019 Kia Sportage5 engines84.2% passC
| Engine | Pass rate | Rank | Grade |
|---|---|---|---|
| 1.6 Petrol | 84.4% | Beats 36% | D |
| 1.6 Diesel | 83.6% | Beats 52% | C |
| 2.0 Diesel | 84.4% | Beats 52% | C |
| 1.6 Hybrid | 84.2% | Beats 44% | C |
| 2.0 Hybrid | 84.8% | Beats 45% | C |
2018 Kia Sportage4 engines83.8% passC
| Engine | Pass rate | Rank | Grade |
|---|---|---|---|
| 1.6 Petrol | 84.0% | Beats 49% | C |
| 1.7 Diesel | 83.0% | Beats 59% | C |
| 1.6 Diesel | 84.2% | Beats 64% | B |
| 2.0 Diesel | 84.4% | Beats 66% | B |
2017 Kia Sportage3 engines82.0% passC
| Engine | Pass rate | Rank | Grade |
|---|---|---|---|
| 1.7 Diesel | 81.5% | Beats 58% | C |
| 1.6 Petrol | 82.3% | Beats 49% | C |
| 2.0 Diesel | 82.7% | Beats 63% | B |
2016 Kia Sportage3 engines80.1% passC
| Engine | Pass rate | Rank | Grade |
|---|---|---|---|
| 1.7 Diesel report → | 79.0% | Beats 54% | C |
| 1.6 Petrol | 80.1% | Beats 48% | C |
| 2.0 Diesel | 81.9% | Beats 70% | B |
2015 Kia Sportage3 engines76.9% passC
| Engine | Pass rate | Rank | Grade |
|---|---|---|---|
| 1.7 Diesel | 75.4% | Beats 39% | D |
| 2.0 Diesel | 81.2% | Beats 76% | B |
| 1.6 Petrol | 75.6% | Beats 28% | D |
2014 Kia Sportage3 engines75.9% passB
| Engine | Pass rate | Rank | Grade |
|---|---|---|---|
| 1.7 Diesel | 74.4% | Beats 59% | C |
| 2.0 Diesel | 79.1% | Beats 80% | A |
| 1.6 Petrol | 74.7% | Beats 48% | C |
2013 Kia Sportage4 engines69.5% passC
| Engine | Pass rate | Rank | Grade |
|---|---|---|---|
| 1.7 Diesel | 67.5% | Beats 40% | D |
| 2.0 Diesel | 72.0% | Beats 62% | B |
| 1.6 Petrol | 70.3% | Beats 46% | C |
| 2.0 Petrol | 73.7% | Beats 52% | C |
2012 Kia Sportage4 engines66.2% passC
| Engine | Pass rate | Rank | Grade |
|---|---|---|---|
| 1.7 Diesel | 64.8% | Beats 43% | C |
| 2.0 Diesel | 66.8% | Beats 52% | C |
| 1.6 Petrol | 68.6% | Beats 53% | C |
| 2.0 Petrol | 74.1% | Beats 73% | B |
2011 Kia Sportage4 engines66.1% passB
| Engine | Pass rate | Rank | Grade |
|---|---|---|---|
| 1.7 Diesel | 65.0% | Beats 60% | C |
| 2.0 Diesel | 66.7% | Beats 63% | B |
| 1.6 Petrol | 66.3% | Beats 58% | C |
| 2.0 Petrol | 71.5% | Beats 74% | B |
2010 Kia Sportage4 engines62.6% passC
| Engine | Pass rate | Rank | Grade |
|---|---|---|---|
| 2.0 Diesel | 62.9% | Beats 58% | C |
| 2.0 Petrol | 60.3% | Beats 42% | C |
| 1.7 Diesel | 65.7% | Beats 69% | B |
| 1.6 Petrol | 64.7% | Beats 62% | B |
2009 Kia Sportage2 engines58.5% passC
| Engine | Pass rate | Rank | Grade |
|---|---|---|---|
| 2.0 Diesel | 59.9% | Beats 54% | C |
| 2.0 Petrol | 55.1% | Beats 29% | D |
2008 Kia Sportage2 engines58.1% passC
| Engine | Pass rate | Rank | Grade |
|---|---|---|---|
| 2.0 Diesel | 60.5% | Beats 63% | B |
| 2.0 Petrol | 52.9% | Beats 31% | D |
2007 Kia Sportage2 engines52.4% passD
| Engine | Pass rate | Rank | Grade |
|---|---|---|---|
| 2.0 Diesel | 53.1% | Beats 42% | C |
| 2.0 Petrol | 51.1% | Beats 29% | D |
2006 Kia Sportage2 engines50.4% passD
| Engine | Pass rate | Rank | Grade |
|---|---|---|---|
| 2.0 Diesel | 50.5% | Beats 38% | D |
| 2.0 Petrol | 50.0% | Beats 32% | D |
2005 Kia Sportage3 engines49.4% passD
| Engine | Pass rate | Rank | Grade |
|---|---|---|---|
| 2.0 Diesel | 50.4% | Beats 41% | C |
| 2.0 Petrol | 47.1% | Beats 27% | D |
| 2.7 Petrol | 51.0% | Beats 35% | D |
FAQ
What is the Kia Sportage MOT pass rate?
77.3% of Kia Sportage MOT tests were passed first time, from 1.9 million tests. A typical car of the same age and mileage passes 77.1%.
Is the Kia Sportage reliable?
On MOT results it is about average: it beats 51% of cars on UK roads, a little ahead of a typical car in middle age but weaker on brakes and steering. MOT results cover safety and emissions items, not every kind of breakdown.
Which Kia Sportage years are best?
2014 cars do best, beating nearly two in three cars on UK roads once age and mileage are taken into account, followed by 2011 cars and then 2016–2018 cars, which beat more than half.
Which Kia Sportage years should I avoid?
2020–2021 cars beat only about one in five cars, and cars from before 2008 fewer than four in ten. 2012–2013 and 2015 cars sit just below the middle.
Which Kia Sportage engine is best?
The 2.0 diesel does best, beating more than six in ten cars. The 1.6 diesel (2018 on) and the common 1.7 diesel sit around the middle, the 1.6 hybrid (2019 on) and 1.6 petrol a little below, and the 2.0 petrol (2005–2013) does worst, beating fewer than four in ten.
What are the most common MOT failures on the Kia Sportage?
Brake pads (about 1 in 29 tests), tyre tread depth, windscreen wipers and handbrake performance.