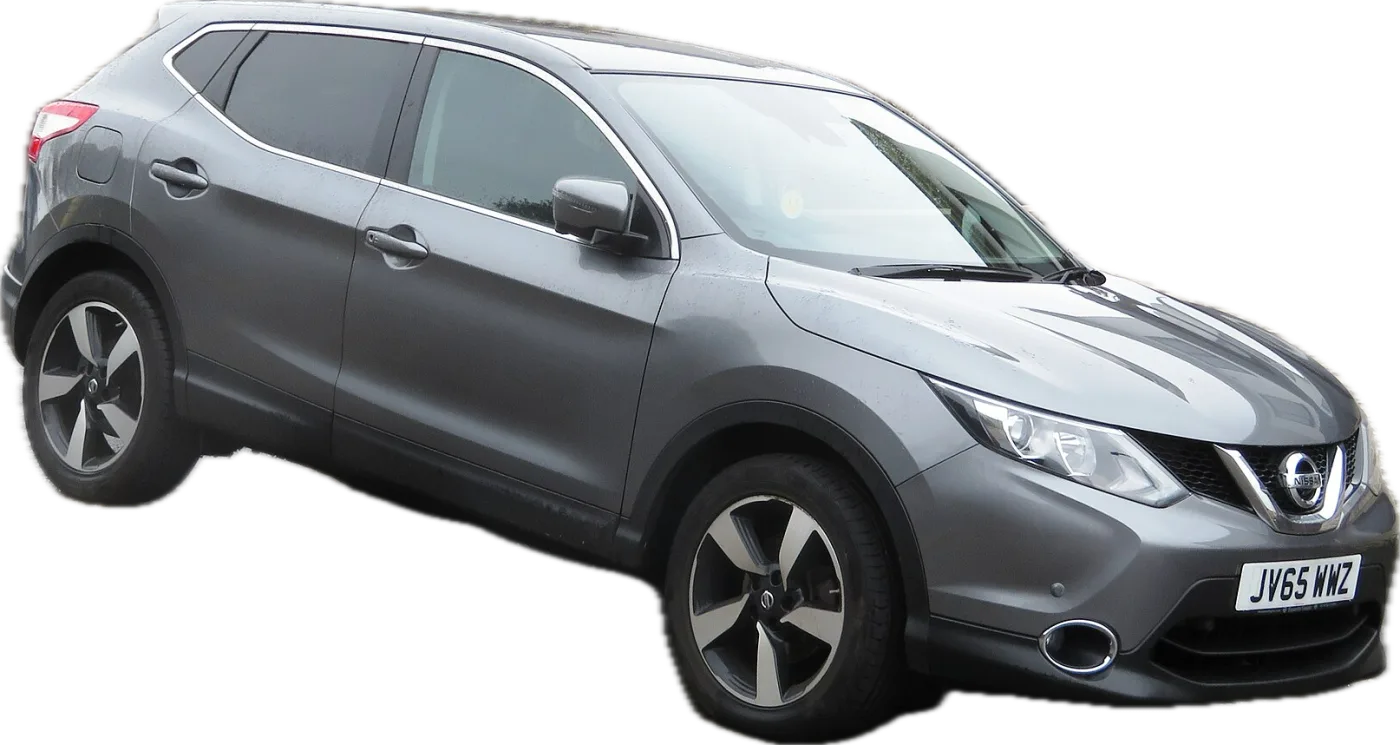
Verdict
The Nissan Qashqai passes its MOT first time on 70.7% of tests, against 73.7% for a typical car of the same age and mileage. It beats only 31% of cars on UK roads. Most similar SUVs do better, including the Kia Sportage, Ford Kuga, VW Tiguan and Toyota RAV4; the Nissan Juke and Peugeot 3008 do worse.
It depends on the generation. First-generation cars (2007–2013) beat only about one in six cars; second-generation cars, from 2014, beat nearly six in ten.
On first-generation cars, track rod ends fail about 5 times as often as on a typical car (on about 1 in 11 tests), suspension ball joints and anti-roll bar links about 4 times, and CV joints nearly 4 times. On newer cars, brake pads are the main weak spot, at about 1.7 times the typical rate.
Watch these weak spots
MOT pass rate by age
First-time pass rate at each MOT by the car’s age in years.
Best and worst years
By year of first registration, ranked against all cars on UK roads after adjusting for age and mileage. Green = better than half of cars.
Engines
All years, most common first. Grades compare each car with cars of the same age and mileage (A = best 20% of cars on UK roads, E = worst 20%), so an older or higher-mileage car can grade above one with a higher pass rate.
| Engine | Pass rate | Rank | Grade |
|---|---|---|---|
| 1.5 Diesel | 67.5% | Beats 25% | D |
| 1.2 Petrol | 82.4% | Beats 63% | B |
| 1.6 Petrol | 60.4% | Beats 21% | D |
| 1.6 Diesel | 72.7% | Beats 42% | C |
| 1.3 Petrol | 87.7% | Beats 65% | B |
| 2.0 Petrol | 55.8% | Beats 24% | D |
| 1.3 Hybrid | 89.0% | Beats 59% | C |
| 2.0 Diesel | 51.1% | Beats 16% | E |
| 1.5 Hybrid | 91.7% | Beats 87% | A |
| 1.7 Diesel | 85.0% | Beats 51% | C |
Where it fails
Each area compared with a typical car of the same age and mileage, in points of pass rate. Tap or hover an area to see what to check.
Every MOT area
Share of tests failing on each area, against a typical car of the same age and mileage (black line).
Buying one or MOT due? Check these
- Track rod ends
Fail about 3.7 times as often as on a typical car overall, and on about 1 in 11 tests of 2007–2013 cars. Feel for play or knocking in the steering and look for wear on the inner edges of the front tyres. - Suspension ball joints
About 3.2 times the typical rate overall: nearly 4 times on 2007–2013 cars and twice on later ones. Listen for knocks over speed bumps and feel for wandering or vague steering. - Anti-roll bar links
Fail about 3.6 times as often as on a typical car. A knock or rattle over uneven roads usually means worn links (cheap to fix). - Drive shaft (CV) joints
About 2.7 times the typical rate, and nearly 4 times on 2007–2013 cars. Look for split boots inside the front wheels and listen for clicking on full lock. - Brake pads
Fail about 1.8 times as often as on a typical car, on older and newer cars alike. Ask when the pads were last replaced and look for a brake-wear warning on the dash. - Sidelights
Fail on about 1 in 11 tests of 2007–2013 cars, about twice the typical rate. Walk around with the lights on and check every bulb.
Pass rate by mileage
First-time pass rate by mileage at the test.
Most common MOT failures
| Item | This car | Typical | vs typical |
|---|---|---|---|
| Track rod ends | 4.3% | 1.2% | 3.7× |
| Suspension ball joints | 4.2% | 1.3% | 3.2× |
| Brake pads | 3.9% | 2.1% | 1.8× |
| Sidelights | 3.7% | 2.3% | 1.6× |
| Tyre tread depth | 2.8% | 2.6% | 1.1× |
| Drive shaft (CV) joints | 2.7% | 1.0% | 2.7× |
| Windscreen wipers | 2.5% | 2.1% | 1.2× |
| Tyre damage & cracking | 2.5% | 3.6% | 0.7× |
| Windscreen washers | 2.3% | 2.0% | 1.2× |
| Headlight aim | 2.0% | 2.8% | 0.7× |
Specific defects found
Tester wording for the most frequent failure items, per 1,000 tests.
| Defect | per 1,000 |
|---|---|
| A suspension pin, bush or joint excessively worn | 74.1 |
| A steering ball joint with excessive wear or free play | 37.1 |
| A brake lining or pad worn below 1.5mm | 36.8 |
| A lamp missing, inoperative or in the case of a multiple light source more than 1/2 not functioning | 32.1 |
| Tyre tread depth not in accordance with the requirements | 28.1 |
| A transmission shaft constant velocity joint boot missing or no longer prevents the ingress of dirt etc | 27.8 |
| Wiper blade missing or obviously not clearing the windscreen | 24.2 |
| Windscreen washers not working or not providing sufficient fluid to clear the windscreen | 23.2 |
Pick a make and model to see its MOT pass rate, best and worst years and weak spots.
Every year and engine
Tap a year to see its engines. Grades compare each car with cars of the same age and mileage (A = best 20% of cars on UK roads, E = worst 20%), so an older or higher-mileage car can grade above one with a higher pass rate.
2023 Nissan Qashqai2 engines90.3% passB
| Engine | Pass rate | Rank | Grade |
|---|---|---|---|
| 1.3 Hybrid | 89.5% | Beats 65% | B |
| 1.5 Hybrid | 91.1% | Beats 82% | A |
2022 Nissan Qashqai3 engines89.3% passB
| Engine | Pass rate | Rank | Grade |
|---|---|---|---|
| 1.3 Hybrid | 89.2% | Beats 59% | C |
| 1.5 Hybrid | 92.6% | Beats 94% | A |
| 1.3 Petrol | 88.5% | Beats 49% | C |
2021 Nissan Qashqai2 engines88.1% passC
| Engine | Pass rate | Rank | Grade |
|---|---|---|---|
| 1.3 Petrol | 87.9% | Beats 55% | C |
| 1.3 Hybrid | 88.5% | Beats 57% | C |
2020 Nissan Qashqai3 engines88.2% passB
| Engine | Pass rate | Rank | Grade |
|---|---|---|---|
| 1.3 Petrol | 88.5% | Beats 66% | B |
| 1.5 Diesel | 86.1% | Beats 62% | B |
| 1.7 Diesel | 85.2% | Beats 45% | C |
2019 Nissan Qashqai3 engines86.1% passB
| Engine | Pass rate | Rank | Grade |
|---|---|---|---|
| 1.3 Petrol | 87.3% | Beats 66% | B |
| 1.5 Diesel | 83.9% | Beats 51% | C |
| 1.7 Diesel | 84.8% | Beats 56% | C |
2018 Nissan Qashqai5 engines83.6% passC
| Engine | Pass rate | Rank | Grade |
|---|---|---|---|
| 1.2 Petrol | 85.0% | Beats 56% | C |
| 1.5 Diesel | 81.6% | Beats 46% | C |
| 1.3 Petrol | 86.6% | Beats 64% | B |
| 1.6 Diesel | 83.5% | Beats 60% | C |
| 1.6 Petrol | 82.7% | Beats 32% | D |
2017 Nissan Qashqai4 engines82.3% passC
| Engine | Pass rate | Rank | Grade |
|---|---|---|---|
| 1.5 Diesel | 80.6% | Beats 50% | C |
| 1.2 Petrol | 84.4% | Beats 60% | C |
| 1.6 Diesel | 81.7% | Beats 56% | C |
| 1.6 Petrol | 81.6% | Beats 33% | D |
2016 Nissan Qashqai4 engines80.2% passC
| Engine | Pass rate | Rank | Grade |
|---|---|---|---|
| 1.5 Diesel | 78.8% | Beats 53% | C |
| 1.2 Petrol | 82.9% | Beats 62% | B |
| 1.6 Diesel | 79.2% | Beats 53% | C |
| 1.6 Petrol | 79.4% | Beats 37% | D |
2015 Nissan Qashqai4 engines78.5% passC
| Engine | Pass rate | Rank | Grade |
|---|---|---|---|
| 1.5 Diesel report → | 76.5% | Beats 55% | C |
| 1.2 Petrol | 81.5% | Beats 67% | B |
| 1.6 Diesel | 77.2% | Beats 56% | C |
| 1.6 Petrol | 78.9% | Beats 51% | C |
2014 Nissan Qashqai4 engines74.6% passC
| Engine | Pass rate | Rank | Grade |
|---|---|---|---|
| 1.5 Diesel | 72.6% | Beats 52% | C |
| 1.2 Petrol | 78.1% | Beats 65% | B |
| 1.6 Diesel | 74.5% | Beats 58% | C |
| 1.6 Petrol | 71.0% | Beats 29% | D |
2013 Nissan Qashqai5 engines64.2% passE
| Engine | Pass rate | Rank | Grade |
|---|---|---|---|
| 1.6 Petrol | 68.1% | Beats 30% | D |
| 1.5 Diesel | 59.2% | Beats 9% | E |
| 1.6 Diesel | 63.8% | Beats 27% | D |
| 2.0 Petrol | 67.8% | Beats 25% | D |
| 2.0 Diesel | 67.3% | Beats 38% | D |
2012 Nissan Qashqai5 engines58.4% passE
| Engine | Pass rate | Rank | Grade |
|---|---|---|---|
| 1.5 Diesel | 53.9% | Beats 7% | E |
| 1.6 Petrol | 62.4% | Beats 21% | D |
| 1.6 Diesel | 58.5% | Beats 21% | D |
| 2.0 Petrol | 64.5% | Beats 26% | D |
| 2.0 Diesel | 60.2% | Beats 22% | D |
2011 Nissan Qashqai5 engines55.7% passE
| Engine | Pass rate | Rank | Grade |
|---|---|---|---|
| 1.5 Diesel | 51.4% | Beats 10% | E |
| 1.6 Petrol | 60.2% | Beats 30% | D |
| 2.0 Diesel | 55.7% | Beats 20% | E |
| 2.0 Petrol | 62.9% | Beats 36% | D |
| 1.6 Diesel | 53.5% | Beats 12% | E |
2010 Nissan Qashqai4 engines51.8% passE
| Engine | Pass rate | Rank | Grade |
|---|---|---|---|
| 1.5 Diesel | 48.9% | Beats 13% | E |
| 1.6 Petrol | 54.9% | Beats 24% | D |
| 2.0 Petrol | 60.4% | Beats 41% | C |
| 2.0 Diesel | 48.9% | Beats 14% | E |
2009 Nissan Qashqai4 engines45.6% passE
| Engine | Pass rate | Rank | Grade |
|---|---|---|---|
| 1.5 Diesel | 43.8% | Beats 9% | E |
| 1.6 Petrol | 46.2% | Beats 10% | E |
| 2.0 Petrol | 49.3% | Beats 15% | E |
| 2.0 Diesel | 43.3% | Beats 9% | E |
2008 Nissan Qashqai4 engines45.1% passE
| Engine | Pass rate | Rank | Grade |
|---|---|---|---|
| 1.6 Petrol | 45.0% | Beats 12% | E |
| 2.0 Petrol | 48.3% | Beats 17% | E |
| 1.5 Diesel | 42.9% | Beats 11% | E |
| 2.0 Diesel | 44.0% | Beats 13% | E |
2007 Nissan Qashqai4 engines45.0% passE
| Engine | Pass rate | Rank | Grade |
|---|---|---|---|
| 1.6 Petrol | 43.6% | Beats 13% | E |
| 2.0 Petrol | 48.7% | Beats 23% | D |
| 1.5 Diesel | 43.7% | Beats 15% | E |
| 2.0 Diesel | 44.3% | Beats 15% | E |
FAQ
What is the Nissan Qashqai MOT pass rate?
70.7% of Nissan Qashqai MOT tests were passed first time, from 4.3 million tests. A typical car of the same age and mileage passes 73.7%.
Is the Nissan Qashqai reliable?
It depends on the generation. Overall it beats only 31% of cars on UK roads, held back by 2007–2013 cars; cars from 2014 on beat nearly six in ten. MOT results cover safety and emissions items, not every kind of breakdown.
Which Nissan Qashqai years are best?
Cars from 2014 on beat nearly six in ten cars on UK roads once age and mileage are taken into account, and cars from 2019 on about six in ten; 2020 cars do best, beating about two in three.
Which Nissan Qashqai years should I avoid?
First-generation cars, 2007–2013, beat only about one in six cars, and 2009 cars only one in ten. They fail most on track rod ends, sidelights, ball joints and CV joints.
Which Nissan Qashqai engine is best?
Of the most common engines, the 1.3 petrol (2018 on) does best, beating about two in three cars. The 1.5 diesel looks weak overall only because of first-generation cars: from 2014 on it beats about half, before that about one in ten.
What are the most common MOT failures on the Nissan Qashqai?
Track rod ends and suspension ball joints (each on about 4% of tests), brake pads and sidelights.