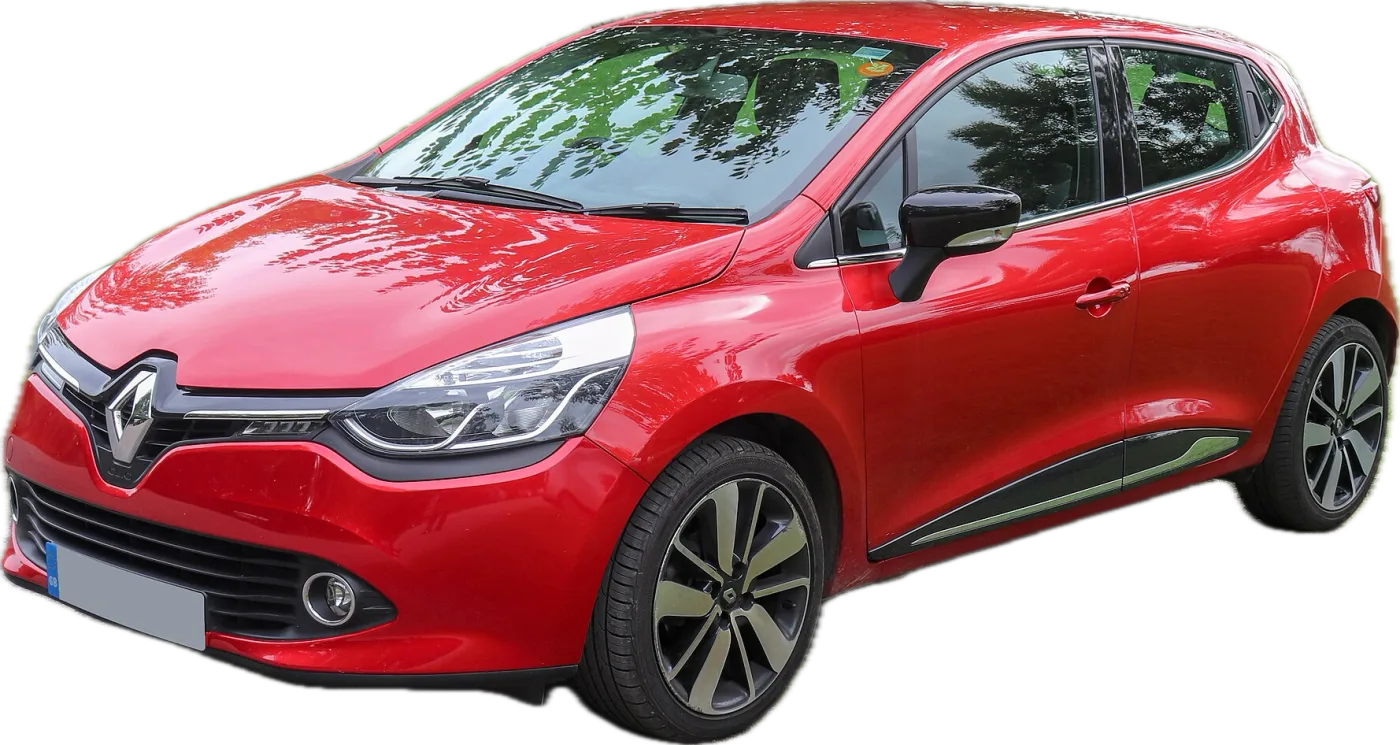
Verdict
The 2015 Renault Clio 1.5 diesel passes its MOT first time on 64.0% of tests, against 77.5% for a typical car of the same age and mileage. It beats only 1% of cars on UK roads, one of the weakest results for its age. The Clio as a whole beats only about 6 in 100 cars, and the 2015 Peugeot 208 1.2 petrol and 2015 Toyota Yaris 1.3 petrol do far better.
It is about 5 points behind a typical car at its first MOT, and the gap widens to about 17 points at 7–9 years old before narrowing slightly to about 16 points by 10–11. Across all years of the 1.5 diesel it is behind at every mileage: about 4 points under 10,000 miles and about 15 points at 70,000–100,000 miles.
No year of this engine does well. The best years, 2001 and 2002, beat only about one in four cars, and every year from 2012 to 2019 beats fewer than one in fifteen. The 2015 Clio's petrol engines are no better: the 0.9 and 1.1 petrol are as weak as the diesel, and only the rare 1.6 petrol beats about one in five cars.
Suspension is the main weak spot, failing 3.1 times as often as on a typical car: suspension ball joints 8.2 times (on about 1 in 13 tests) and coil springs 3.8 times. Brakes, tyres, visibility and lights and electrics (1.5 times) also fail more often than typical.
Watch these weak spots
MOT pass rate by age
First-time pass rate at each MOT.
Where it fails
Each area compared with a typical car of the same age and mileage, in points of pass rate. Tap or hover an area to see what to check.
Every MOT area
Share of tests failing on each area, against a typical car of the same age and mileage (black line).
Buying one or MOT due? Check these
- Suspension ball joints
The most common fail, on about 1 in 13 tests, 8.3 times as often as on a typical car, and testers advise on them about 4.5 times as often. Listen for knocks over speed bumps, feel for wandering or vague steering, and have the front suspension checked for play before you buy. - Coil springs
Fail on about 1 in 15 tests, 3.8 times the typical rate. Look behind each wheel for a snapped coil and listen for clunks over bumps. - Brakes and handbrake
Brake performance fails about 4.6 times as often as on a typical car (about 1 in 30 tests), often for a binding brake, and the handbrake about 4 times. On the test drive the car should brake straight and roll freely; check the handbrake holds firmly on a slope. - Brake pipes
Testers advise on brake pipes on about 1 in 11 tests, about 8 times the typical rate. Look underneath for heavily corroded pipes and check past MOT advisories. - Drive shaft (CV) joints
Fail on about 1 in 40 tests, 3.6 times as often as on a typical car. Look for split boots and grease inside the front wheels, and listen for clicking on full lock. - Tyre pressure warning (TPMS)
Fails on about 1 in 45 tests, 2.4 times the typical rate. Make sure no tyre-pressure warning light stays on after start-up. - Wipers and headlight aim
Wipers fail on about 1 in 25 tests (twice the typical rate) and headlight aim on about 1 in 25 (1.9 times). Check the blades clear the screen, and park facing a wall at night: both dipped beams should sit level.
Pass rate by mileage
First-time pass rate by mileage at the test.
Most common MOT failures
| Item | This car | Typical | vs typical |
|---|---|---|---|
| Suspension ball joints | 8.0% | 1.0% | 8.2× |
| Coil springs | 6.5% | 1.7% | 3.8× |
| Tyre damage & cracking | 5.2% | 3.2% | 1.6× |
| Headlight aim | 4.2% | 2.2% | 1.9× |
| Windscreen wipers | 4.1% | 2.0% | 2.0× |
| Tyre tread depth | 3.1% | 2.4% | 1.3× |
| Brake performance | 3.1% | 0.7% | 4.6× |
| Drive shaft (CV) joints | 2.5% | 0.7% | 3.7× |
| Brake pads | 2.4% | 2.1% | 1.1× |
| Brake lights | 2.2% | 1.2% | 1.8× |
Specific defects found
Tester wording for the most frequent failure items, per 1,000 tests.
| Defect | per 1,000 |
|---|---|
| A suspension pin, bush or joint excessively worn | 95.7 |
| A spring or spring component fractured or seriously weakened | 65.0 |
| The aim of a headlamp is not within limits laid down in the requirements | 42.0 |
| Wiper blade missing or obviously not clearing the windscreen | 37.7 |
| Tyre tread depth not in accordance with the requirements | 31.1 |
| Significant brake effort recorded with no brake applied indicating a binding brake | 28.8 |
| A transmission shaft constant velocity joint boot missing or no longer prevents the ingress of dirt etc | 26.0 |
| A tyre cords visible or damaged | 25.4 |
Pick a make and model to see its MOT pass rate, best and worst years and weak spots.
Advisories
Not a fail yet, but likely to need attention soon.
| Item | Share of tests | vs typical |
|---|---|---|
| Tyre tread depth | 19.5% | 1.1× |
| Tyre damage & cracking | 11.6% | 1.4× |
| Brake discs | 11.1% | 1.2× |
| Brake pipes | 9.4% | 8.1× |
| Brake pads | 6.2% | 0.8× |
| Brake performance | 3.6% | 2.7× |
| Suspension ball joints | 3.4% | 4.5× |
| Wheel condition | 3.2% | 5.2× |
Best and worst years
Clio 1.5 Diesel by year, ranked against all cars on UK roads after adjusting for age and mileage. Green = better than half of cars.
Other 2015 Clio engines
Grades compare each car with cars of the same age and mileage (A = best 20% of cars on UK roads, E = worst 20%), so an older or higher-mileage car can grade above one with a higher pass rate.
| Engine | Pass rate | Rank | Grade |
|---|---|---|---|
| 1.5 Diesel | 64.0% | Beats 1% | E |
| 0.9 Petrol | 67.8% | Beats 1% | E |
| 1.1 Petrol | 64.7% | Beats 0% | E |
| 1.6 Petrol | 74.8% | Beats 19% | E |
| 1.2 Petrol | 74.0% | Beats 8% | E |
FAQ
What is the MOT pass rate of a 2015 Renault Clio 1.5 diesel?
64.0% of MOT tests on the 2015 Renault Clio 1.5 diesel were passed first time, from 87,859 tests. A typical car of the same age and mileage passes 77.5%.
Is the 2015 Renault Clio 1.5 diesel reliable?
On MOT results it is one of the weakest cars for its age: it beats only 1% of cars on UK roads. MOT results cover safety and emissions items, not every kind of breakdown.
What are the most common MOT failures on the 2015 Renault Clio 1.5 diesel?
Suspension ball joints (about 1 in 13 tests), coil springs (about 1 in 15), tyre damage, headlight aim and wipers.
Which year of Renault Clio 1.5 diesel is best?
None does well. The best years, 2001 and 2002, beat only about one in four cars on UK roads once age and mileage are taken into account, and every year from 2012 to 2019 beats fewer than one in fifteen.
Which 2015 Renault Clio engine is best?
None beats many cars. The 0.9 and 1.1 petrol are as weak as the 1.5 diesel; only the rare 1.6 petrol beats about one in five cars.