Verdict
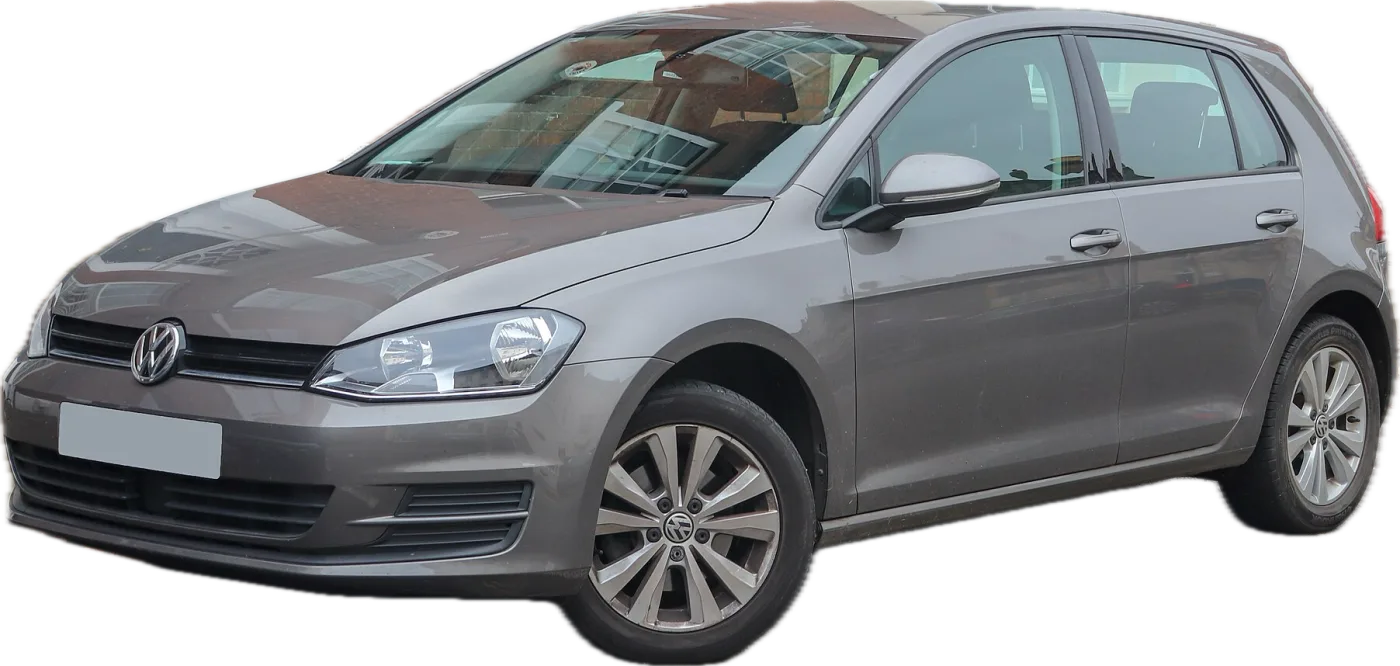
The 2015 Volkswagen Golf 1.6 diesel passes its MOT first time on 81.9% of tests, against 76.1% for a typical car of the same age and mileage. It beats 85% of cars on UK roads.
Its first MOT is its weakest: at 3 years old it passes about 3 points less often than a typical car. From 4 years on it pulls ahead, by about 5 points at 6, 8 at 8 and about 10 at 10–11. Across all years of the 1.6 diesel, it is slightly behind a typical car under 20,000 miles and about 7 points ahead from 60,000 to 90,000 miles.
2013–2016 are the best years of this engine, each beating more than eight in ten cars, with 2014 slightly ahead (the few 2020 cars do as well). 2009–2012 and 2017 cars beat about seven in ten, and 2018–2019 cars a little under two in three. Every other 2015 Golf engine does a little better: the 1.4 petrol, 2.0 diesel and 2.0 petrol beat more than nine in ten cars. The Golf as a whole beats about seven in ten.
Lights, steering, bodywork, suspension and brakes all fail less often than on a typical car. The weak spots are shock absorbers (2.1 times the typical rate), the engine warning light and wipers (each 1.4 times).
Watch these weak spots
MOT pass rate by age
First-time pass rate at each MOT.
Where it fails
Each area compared with a typical car of the same age and mileage, in points of pass rate. Tap or hover an area to see what to check.
Every MOT area
Share of tests failing on each area, against a typical car of the same age and mileage (black line).
Buying one or MOT due? Check these
- Shock absorbers
Fail on about 1 in 60 tests, 2.1 times as often as on a typical car, and testers advise on them on about 1 in 5 tests, more than 6 times the typical rate. Push down hard on each corner: it should rebound once and settle. Look for oily dampers and check past MOT advisories. - Engine warning light
Fails on about 1 in 65 tests, 1.4 times the typical rate. It should come on with the ignition and go out once the engine starts; if it stays on, get the fault codes read before you buy. - Wipers
The joint most common fail, on about 1 in 30 tests (1.4 times the typical rate). Check the blades clear the screen without smearing. - Tyres
Tyre damage fails on about 1 in 30 tests and tread depth about 1 in 50, both below typical, but tread depth is an advisory on about 1 in 6 tests. Check every tyre for cuts and bulges, and for at least 3 mm of tread including the inner edge. - Brake pads and discs
Pads fail on about 1 in 60 tests, less often than typical, but disc advisories come up on about 1 in 9 tests, 1.2 times the typical rate. Look through the wheel spokes for scored discs or a heavy rust lip. - Headlight aim and coil springs
Headlight aim fails on about 1 in 60 tests and coil springs about 1 in 70, both less often than on a typical car. Check both dipped beams sit level and look behind each wheel for a snapped coil.
Pass rate by mileage
First-time pass rate by mileage at the test.
Most common MOT failures
| Item | This car | Typical | vs typical |
|---|---|---|---|
| Tyre damage & cracking | 3.1% | 3.3% | 0.9× |
| Windscreen wipers | 3.1% | 2.1% | 1.4× |
| Tyre tread depth | 2.0% | 2.7% | 0.8× |
| Brake pads | 1.7% | 2.3% | 0.7× |
| Shock absorbers | 1.6% | 0.8% | 2.1× |
| Headlight aim | 1.6% | 2.3% | 0.7× |
| Engine warning light | 1.6% | 1.1% | 1.4× |
| Coil springs | 1.4% | 1.8% | 0.8× |
| Windscreen washers | 1.1% | 1.7% | 0.6× |
| Headlight bulbs & units | 0.9% | 1.4% | 0.6× |
Specific defects found
Tester wording for the most frequent failure items, per 1,000 tests.
| Defect | per 1,000 |
|---|---|
| Wiper blade missing or obviously not clearing the windscreen | 24.0 |
| Tyre tread depth not in accordance with the requirements | 19.9 |
| A tyre seriously damaged | 18.2 |
| The aim of a headlamp is not within limits laid down in the requirements | 16.1 |
| A shock absorber damaged to the extent that it does not function or showing signs of severe leakage | 15.9 |
| Engine MIL illuminated indicating a malfunction | 15.7 |
| A spring or spring component fractured or seriously weakened | 14.3 |
| A brake lining or pad worn below 1.5mm | 13.8 |
Pick a make and model to see its MOT pass rate, best and worst years and weak spots.
Advisories
Not a fail yet, but likely to need attention soon.
| Item | Share of tests | vs typical |
|---|---|---|
| Shock absorbers | 19.6% | 6.4× |
| Tyre tread depth | 16.5% | 0.9× |
| Brake discs | 11.6% | 1.2× |
| Tyre damage & cracking | 9.8% | 1.3× |
| Brake pads | 7.8% | 0.9× |
| Engine oil leaks | 1.5% | 0.8× |
| Suspension arm bushes | 1.5% | 0.4× |
| Brake performance | 1.4% | 1.0× |
Best and worst years
Golf 1.6 Diesel by year, ranked against all cars on UK roads after adjusting for age and mileage. Green = better than half of cars.
Other 2015 Golf engines
Grades compare each car with cars of the same age and mileage (A = best 20% of cars on UK roads, E = worst 20%), so an older or higher-mileage car can grade above one with a higher pass rate.
| Engine | Pass rate | Rank | Grade |
|---|---|---|---|
| 1.6 Diesel | 81.9% | Beats 85% | A |
| 1.4 Petrol | 86.3% | Beats 94% | A |
| 2.0 Diesel | 83.2% | Beats 92% | A |
| 2.0 Petrol | 87.0% | Beats 97% | A |
| 1.4 Hybrid | 85.1% | Beats 95% | A |
| 1.2 Petrol | 84.5% | Beats 91% | A |
| 1.0 Petrol | 84.8% | Beats 87% | A |
FAQ
What is the MOT pass rate of a 2015 Volkswagen Golf 1.6 diesel?
81.9% of MOT tests on the 2015 Volkswagen Golf 1.6 diesel were passed first time, from 180,810 tests. A typical car of the same age and mileage passes 76.1%.
Is the 2015 Volkswagen Golf 1.6 diesel reliable?
On MOT results it is well above average: it beats 85% of cars on UK roads, and its lead over a typical car grows as it gets older. MOT results cover safety and emissions items, not every kind of breakdown.
What are the most common MOT failures on the 2015 Golf 1.6 diesel?
Tyre damage and wipers (each about 1 in 30 tests), tyre tread depth, brake pads and shock absorbers. Shock absorbers fail 2.1 times as often as on a typical car.
Which year of Golf 1.6 diesel is best?
2013–2016: each beats more than eight in ten cars on UK roads once age and mileage are taken into account, 2014 most of all. 2009–2012 cars beat about seven in ten.
Which 2015 Golf engine is best?
The 1.6 diesel is the weakest of the 2015 Golf engines, though still well above average. The 1.4 petrol, 2.0 diesel and 2.0 petrol each beat more than nine in ten cars.
Does the Golf 1.6 diesel do well at its first MOT?
Not as well as later: at 3 years old it passes about 3 points less often than a typical car, but it is ahead at every MOT after that.