Makes › Škoda

Škoda reliability

B · Good

MOT results for 11 Škoda models from 6,031,430 tests, 2018–2026.

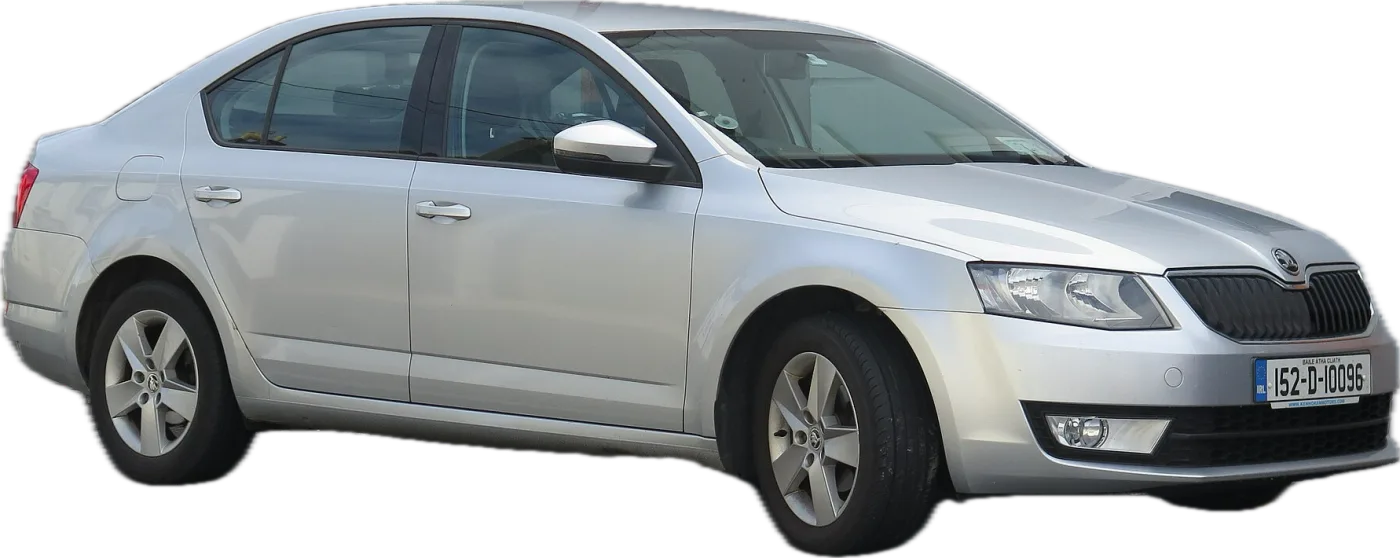
Škoda Octavia
75.7%pass first time
+2.8 ptsvs typical car
13th of 40makes
6,031,430MOT tests

Verdict

Škoda cars pass their MOT first time on 75.7% of tests, against 72.9% for a typical car of the same age and mileage. That beats 66% of cars on UK roads and ranks Škoda 13th of 40 makes, well ahead of Ford, Vauxhall and Peugeot.

The Kodiaq (2017 on) and Karoq (2018 on) do best, beating 91% and 88% of cars. The Yeti (2009–2017) beats 81%, the Superb 79% and the Octavia 76%.

The Fabia, the most tested Škoda, is the one to check most carefully: it beats 49% of cars, a little below a typical car of its age and mileage, and the only common Škoda that does. The Citigo (60%), Rapid (58%) and Roomster (58%) sit a little above the middle.

Škodas fail less often than a typical car in every MOT area. The gap is widest on steering (about 40% fewer fails), visibility (about 25% fewer) and lights and electrics, the most common area (about 20% fewer). Suspension, tyres, body and emissions fail only a little less often than typical.

Best Škoda models

Models with 50,000+ MOT tests. Beats = share of cars on UK roads it does better than.

Check most carefully

Where it fails

Every Škoda compared with typical cars of the same age and mileage.

Exhaust: 2.6% of tests fail on emissions & leaks, against 2.7% for a typical car of the same age and mileage. Listen for a blowing exhaust at start-up and look underneath for oil or fluid leaks.Suspension: 7.4% of tests fail on suspension, against 7.9% for a typical car of the same age and mileage. Listen for knocks over speed bumps and push each corner down: it should settle at once.Lights: 8.7% of tests fail on lights & electrics, against 10.6% for a typical car of the same age and mileage. Walk round the car with every light on, including brake, fog and number plate lights.Tyres: 5.9% of tests fail on tyres, against 6.4% for a typical car of the same age and mileage. Check the tread on every tyre, including the inner edge, and look for cuts or bulges.Brakes: 5.6% of tests fail on brakes, against 6.3% for a typical car of the same age and mileage. Brake firmly on the test drive: the car should stop straight with no pulsing or grinding.Lights: 8.7% of tests fail on lights & electrics, against 10.6% for a typical car of the same age and mileage. Walk round the car with every light on, including brake, fog and number plate lights.Lights+1.9 ptsTyres: 5.9% of tests fail on tyres, against 6.4% for a typical car of the same age and mileage. Check the tread on every tyre, including the inner edge, and look for cuts or bulges.Tyres+0.5 ptsBrakes: 5.6% of tests fail on brakes, against 6.3% for a typical car of the same age and mileage. Brake firmly on the test drive: the car should stop straight with no pulsing or grinding.Brakes+0.7 ptsSuspension: 7.4% of tests fail on suspension, against 7.9% for a typical car of the same age and mileage. Listen for knocks over speed bumps and push each corner down: it should settle at once.Suspension+0.6 ptsExhaust: 2.6% of tests fail on emissions & leaks, against 2.7% for a typical car of the same age and mileage. Listen for a blowing exhaust at start-up and look underneath for oil or fluid leaks.Exhaust+0.1 ptsSuspension: 7.4% of tests fail on suspension, against 7.9% for a typical car of the same age and mileage. Listen for knocks over speed bumps and push each corner down: it should settle at once.Brakes: 5.6% of tests fail on brakes, against 6.3% for a typical car of the same age and mileage. Brake firmly on the test drive: the car should stop straight with no pulsing or grinding.Tyres: 5.9% of tests fail on tyres, against 6.4% for a typical car of the same age and mileage. Check the tread on every tyre, including the inner edge, and look for cuts or bulges.Lights: 8.7% of tests fail on lights & electrics, against 10.6% for a typical car of the same age and mileage. Walk round the car with every light on, including brake, fog and number plate lights.Exhaust: 2.6% of tests fail on emissions & leaks, against 2.7% for a typical car of the same age and mileage. Listen for a blowing exhaust at start-up and look underneath for oil or fluid leaks.Lights: 8.7% of tests fail on lights & electrics, against 10.6% for a typical car of the same age and mileage. Walk round the car with every light on, including brake, fog and number plate lights.Lights+1.9 ptsTyres: 5.9% of tests fail on tyres, against 6.4% for a typical car of the same age and mileage. Check the tread on every tyre, including the inner edge, and look for cuts or bulges.Tyres+0.5 ptsBrakes: 5.6% of tests fail on brakes, against 6.3% for a typical car of the same age and mileage. Brake firmly on the test drive: the car should stop straight with no pulsing or grinding.Brakes+0.7 ptsSuspension: 7.4% of tests fail on suspension, against 7.9% for a typical car of the same age and mileage. Listen for knocks over speed bumps and push each corner down: it should settle at once.Suspension+0.6 ptsExhaust: 2.6% of tests fail on emissions & leaks, against 2.7% for a typical car of the same age and mileage. Listen for a blowing exhaust at start-up and look underneath for oil or fluid leaks.Exhaust+0.1 pts
Better than typicalTypicalWorse than typical
Exhaust: 2.6% of tests fail on emissions & leaks, against 2.7% for a typical car of the same age and mileage. Listen for a blowing exhaust at start-up and look underneath for oil or fluid leaks.

Every MOT area

Share of tests failing on each area, against a typical car of the same age and mileage (black line).

Lights & electrics
8.7% vs 10.6%
Suspension
7.4% vs 7.9%
Tyres
5.9% vs 6.4%
Brakes
5.6% vs 6.3%
Visibility
3.4% vs 4.6%
Body & structure
2.7% vs 2.8%
Emissions & leaks
2.6% vs 2.7%
Steering
1.0% vs 1.6%
Seat belts & airbags
0.8% vs 0.9%
Wheels
0.2% vs 0.4%
Check another car

Pick a make and model to see its MOT pass rate, best and worst years and weak spots.

Škoda models

Models with 20,000+ MOT tests, most common first. Grades compare each car with cars of the same age and mileage (A = best 20% of cars on UK roads, E = worst 20%), so an older or higher-mileage car can grade above one with a higher pass rate. Light vans are included and tend to grade lower, partly from hard commercial use.

Model first registeredTestsPass rateRankGrade
Fabia 2000–20231,984,82270.3%Beats 49%C
Octavia 2000–20231,667,00374.6%Beats 76%B
Yeti 2009–2017631,51880.1%Beats 81%A
Superb 2003–2022453,10878.6%Beats 79%B
Citigo 2012–2020405,21481.5%Beats 60%C
Karoq 2018–2023249,92389.4%Beats 88%A
Kodiaq 2017–2023192,51788.4%Beats 91%A
Rapid 2012–2019177,02977.4%Beats 58%C
Roomster 2006–2015164,40468.8%Beats 58%C
Kamiq 2020–202249,97788.4%Beats 59%C
Scala 2019–202332,19887.3%Beats 54%C

FAQ

What is the Škoda MOT pass rate?

75.7% of Škoda MOT tests were passed first time, from 6.0 million tests. A typical car of the same age and mileage passes 72.9%, so Škodas do better than typical.

Is Škoda reliable?

On MOT results it is above average: Škoda beats 66% of cars on UK roads and ranks 13th of 40 makes. MOT results cover safety and emissions items, not every kind of breakdown.

Which Škoda model is most reliable?

The Kodiaq and Karoq: each beats about nine in ten cars on UK roads once age and mileage are taken into account. The Yeti and Superb beat about eight in ten.

Which Škoda should I check most carefully?

The Fabia, which beats a little under half of cars. It is the only common Škoda model that does slightly worse than a typical car of its age and mileage.

What are the most common MOT failures on Škodas?

Lights and electrics (about 1 in 11 tests), suspension, tyres and brakes, all a little less often than on a typical car of the same age and mileage.

How we calculate this. We use official MOT results for cars tested in Great Britain from 2018 to 2026. Each car is compared with typical cars of the same age and mileage, so old and new cars are judged fairly; “pts” are percentage points above or below them. Differences also reflect how cars are used and maintained, not only how they are built.