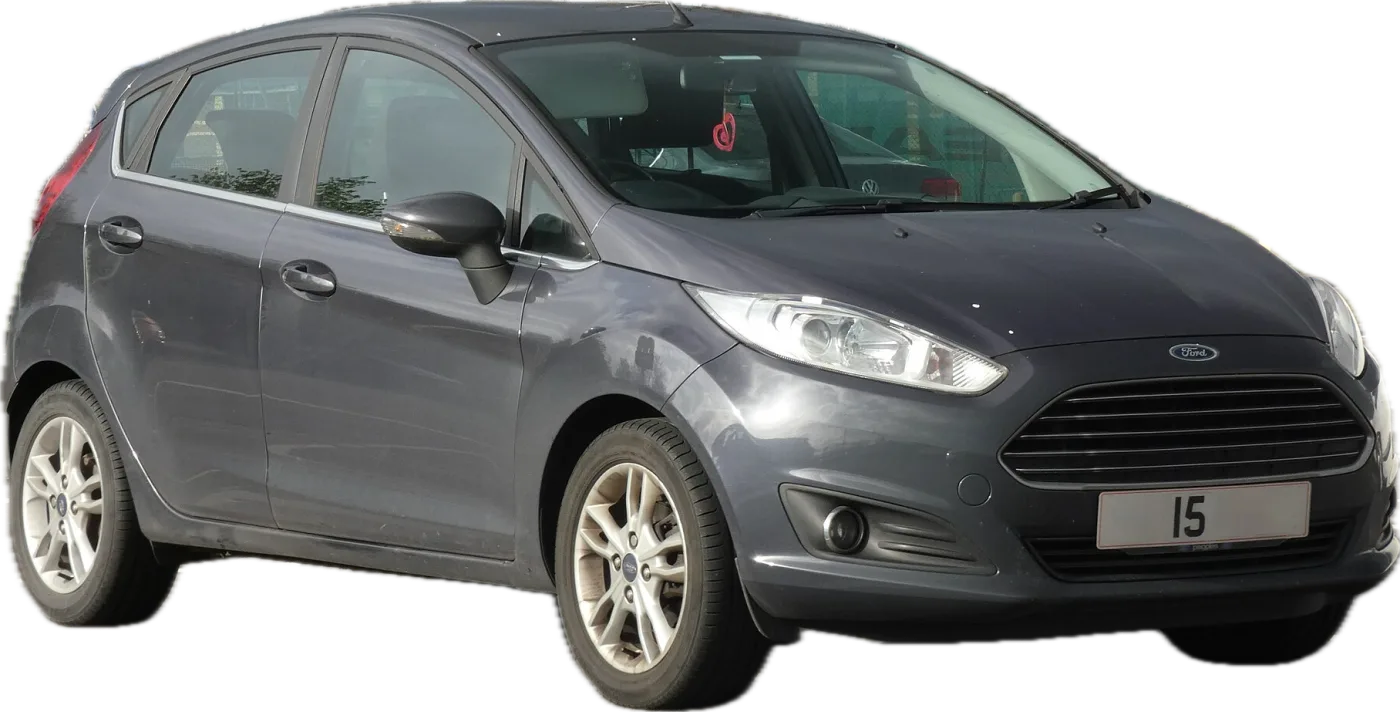
Verdict
Ford cars and vans pass their MOT first time on 67.4% of tests, against 69.7% for a typical car of the same age and mileage. That beats 37% of cars on UK roads and ranks Ford 26th of 40 makes: well behind Volkswagen and Toyota, well ahead of Citroën and Renault.
The best models are the Edge (2016–2019), which beats 83% of cars, the Puma (2020 on, 81%) and the Kuga (69%). The Mondeo beats 60% and the Mustang 53%; the Focus is close to average at 49%.
Check most carefully: the Transit Courier van beats only 7% of cars, the EcoSport 11%, the Ka 15% and the B-Max 22%. The Fiesta, the most common Ford, beats only 27%, and the original Puma coupé (1997–2002) 37%.
Lights and electrics fail on about 15% of tests, about 1.2 times as often as on a typical car of the same age and mileage; body and structure, suspension, steering and tyres fail slightly more often than typical, and brakes about as often. Ford's vans pull the make down, partly from hard commercial use: the Transit beats 25% of cars, the Transit Connect 30% and the Transit Custom 24%.
Best Ford models
Models with 50,000+ MOT tests. Beats = share of cars on UK roads it does better than.
Check most carefully
- Transit Courier Beats 7%
- EcoSport Beats 11%
- Ka Beats 15%
- B-Max Beats 22%
- Transit Custom Beats 24%
Where it fails
Every Ford compared with typical cars of the same age and mileage.
Every MOT area
Share of tests failing on each area, against a typical car of the same age and mileage (black line).
Pick a make and model to see its MOT pass rate, best and worst years and weak spots.
Ford models
Models with 20,000+ MOT tests, most common first. Grades compare each car with cars of the same age and mileage (A = best 20% of cars on UK roads, E = worst 20%), so an older or higher-mileage car can grade above one with a higher pass rate. Light vans are included and tend to grade lower, partly from hard commercial use.
| Model first registered | Pass rate | Rank | Grade |
|---|---|---|---|
| Fiesta 1988–2023 | 66.5% | Beats 27% | D |
| Focus 1998–2023 | 66.8% | Beats 49% | C |
| Transit 1988–2023 | 62.1% | Beats 25% | D |
| Mondeo 1995–2021 | 64.7% | Beats 60% | B |
| Kuga 2008–2023 | 80.0% | Beats 69% | B |
| Ka 1997–2019 | 65.4% | Beats 15% | E |
| Transit Connect 2002–2023 | 62.4% | Beats 30% | D |
| C-Max 2003–2019 | 67.4% | Beats 53% | C |
| Ranger 1999–2023 | 70.3% | Beats 41% | C |
| Transit Custom 2015–2023 | 77.7% | Beats 24% | D |
| S-Max 2006–2021 | 65.3% | Beats 49% | C |
| EcoSport 2014–2023 | 79.7% | Beats 11% | E |
| Galaxy 1999–2022 | 61.2% | Beats 38% | D |
| Fusion 2002–2012 | 60.5% | Beats 53% | C |
| B-Max 2012–2018 | 74.9% | Beats 22% | D |
| Grand C-Max 2011–2019 | 70.4% | Beats 31% | D |
| Puma 2020–2023 | 90.8% | Beats 81% | A |
| Transit Courier 2014–2023 | 70.9% | Beats 7% | E |
| Tourneo 2013–2022 | 76.4% | Beats 35% | D |
| Tourneo Connect 2014–2023 | 79.1% | Beats 27% | D |
| Escort 1980–2002 | 68.6% | Beats 60% | C |
| Mustang 2005–2022 | 84.8% | Beats 53% | C |
| Edge 2016–2019 | 85.4% | Beats 83% | A |
| Puma (1997–2002) 1998–2002 | 54.8% | Beats 37% | D |
FAQ
What is the Ford MOT pass rate?
67.4% of Ford MOT tests were passed first time, from 38.4 million tests. A typical car of the same age and mileage passes 69.7%, so Fords do a little worse than typical.
Are Fords reliable?
On MOT results they are below average: Ford beats 37% of cars on UK roads once age and mileage are taken into account, and ranks 26th of 40 makes. Some models do well: the Edge beats 83% and the Puma 81%. MOT results cover safety and emissions items, not every kind of breakdown.
Which Ford model is most reliable?
The Edge (2016–2019) does best, beating 83% of cars on UK roads once age and mileage are taken into account, followed by the Puma and Kuga. Of the two most common models, the Focus is close to average and the Fiesta below it.
Which Ford should I avoid?
The Transit Courier van does worst of the common models, beating only 7% of cars, followed by the EcoSport, the Ka and the B-Max. The Fiesta beats 27%.
What do Fords fail their MOT on?
Lights and electrics (about 15% of tests), suspension (about 11%), then tyres and brakes (about 7% each). Lights and electrics fail about 1.2 times as often as on a typical car of the same age and mileage.